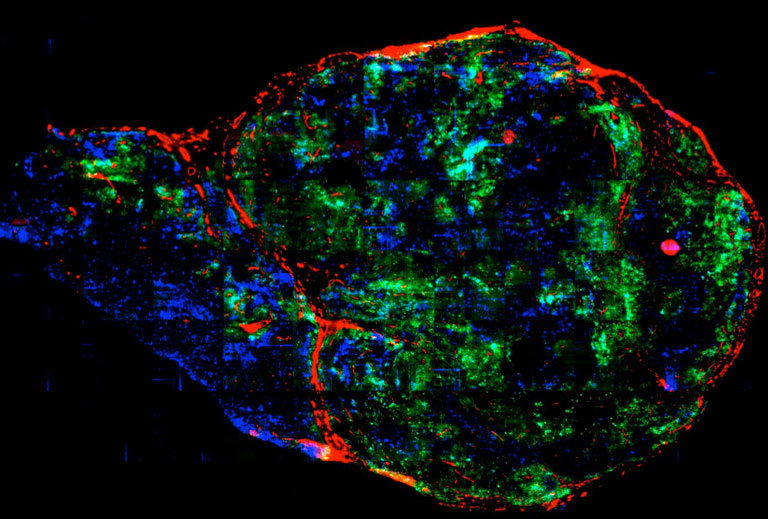
Poor Antibody Distribution in a Tumor
Poor Antibody Distribution in a Tumor
Submitted by Professor Dane Wittrup of the Koch Institute
MIT Department of Biological Engineering, Koch Institute at MIT, MIT Department of Chemical Engineering
Dane Wittrup
Koch Institute for Integrative Cancer Research at MIT
Deconvolution Micrograph
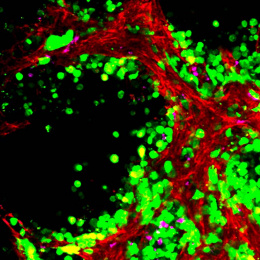
"This figure shows poor distribution of an antibody through a tumor grown in a mouse. The red color identifies blood vessels, the blue color identifies the target molecule that the antibody binds to, and the green color identifies the antibody. If the drug were well distributed, green would cover all of the blue - the plain blue areas represent untreated cells in the tumor."
