Illustration to Visualize the Entire B Cell Receptor Repertoire 5
Illustration to Visualize the Entire B Cell Receptor Repertoire 5
Y. Jason Zhang (submitter), Duncan M. Morgan, Darrell J. Irvine, J. Christopher Love
Koch Institute at MIT
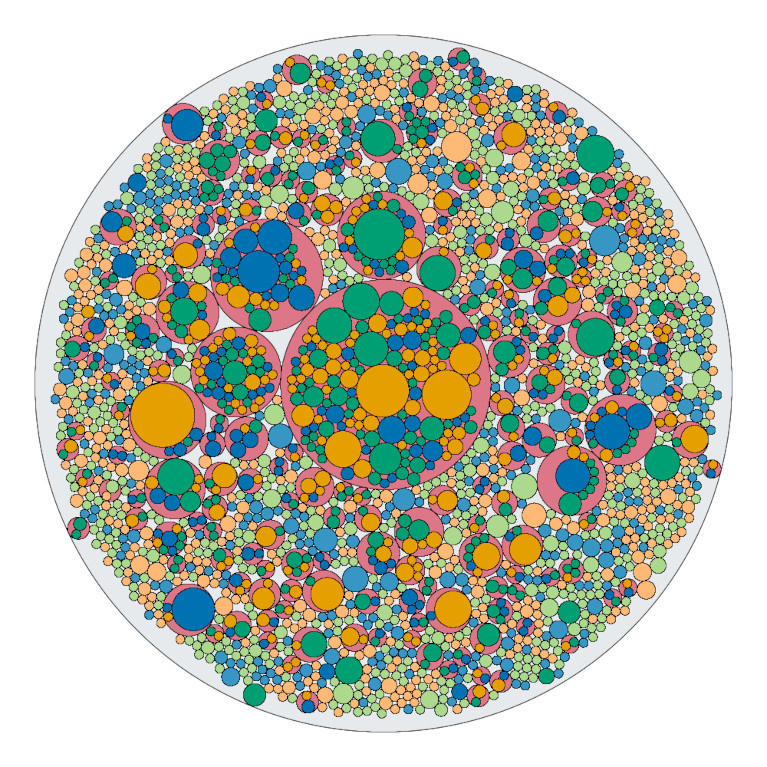
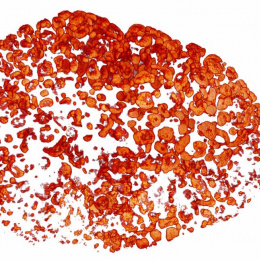
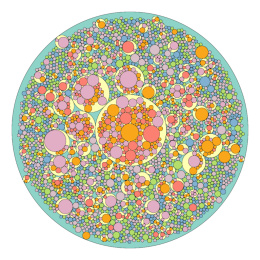
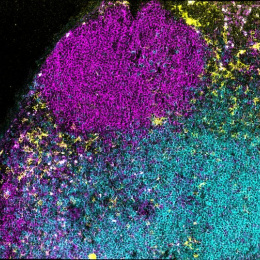
This figure shows how our body is generating diverse antibody pools after receiving a vaccine shot. Each small circle is a “family”, or clone, of B cells that are making the antibodies. The sizes of each circle show how many family members there are, or the number of B cells in the clone. Using the single-cell BCR sequencing technique and computational analysis pipelines we developed in our lab, we can now study the vaccine and adaptive immune response at an unprecedented analytical resolution, where this image is one example that we can “see” exactly what antibodies our B cells are making, how many B cells are making them, and how are the antibodies similar or different using different vaccine formulations.