Visualization of Anti-Tumor T Cells 1
Visualization of Anti-Tumor T Cells 1
Collections: Cancer Immunology & Immunotherapy
Peter Westcott, Nathan Sacks, Jason Schenkel, Olivia Smith, Daniel Zhang, Hannah Hoffman, William Hwang, Tyler Jacks
MIT Department of Biology, Koch Institute at MIT
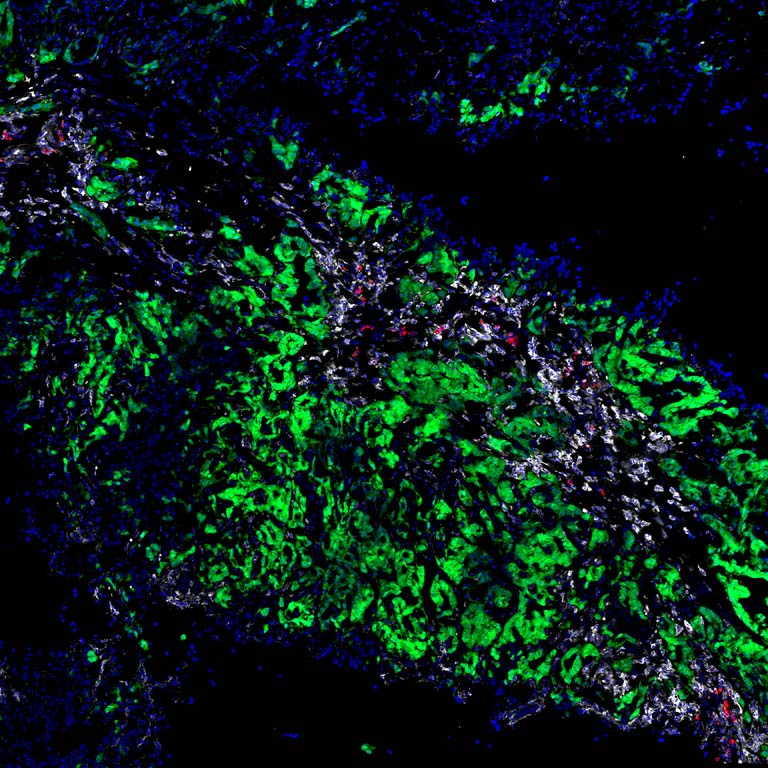
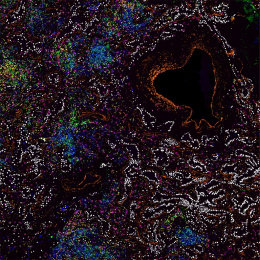
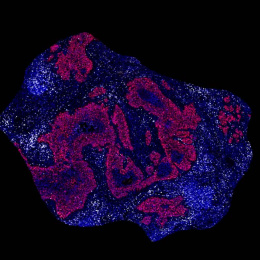
This image shows high magnification fluorescence confocal microscopy of a mouse colon adenocarcinoma (green) infiltrated by cytotoxic CD8+ T cells (white*), with tumor-specific CD8+ T cells additionally highlighted (red*). Nuclei mark live cells (blue*).
This image was taken first to demonstrate that our new model of colon cancer harbors antigen-specific T cells, despite progression and metastasis of the tumor, and second to visualize the spatial distribution and frequency of these antigen-specific T cells in the tumor. The goal is to understand why tumors progress, despite an ongoing (albeit dysfunctional) anti-tumor T cell response, and to understand how the dynamics of this T cell response change in both responders and non-responders to immunotherapy treatment. These studies may provide powerful insights into why some colorectal cancer patients respond to immunotherapy while others do not, with the ultimate goal of improving response in the clinic.